
NBA Player Performance--When Does It Peak?
Visualizing at what age NBA players hit their "peak performance".
Project Summary
I’ve been an NBA fan for most of my life, and I take special interest in how great teams are built. Often, great teams come and go as their core players age and, unsurprisingly, their performance declines. However, some teams have been able to avoid this expected trend by making smart managerial decisions, cleverly moving players at their peak basketball performance–when their trade value is at its highest–just before they begin to decline.
One notable example is the Boston Celtics and their general manager at the time, Danny Ainge. Since 2007, the Celtics have reached the Playoffs all but one year, the Conference Finals seven times, and the Finals three times (2008, 2010, and 2022). What is most impressive and atypical of a franchise is that the Celtics did not reach the Finals in 2008 and 2010 with the same core of players as they did in 2022. Kevin Garnett, Paul Pierce, and Ray Allen led the old era Celtics to victory, while Jayson Tatum and Jaylen Brown now lead the new era Celtics (who currently have the top record in the NBA this season). They key to this successful transition was Ainge’s timing in trading his peaking stars just before their decline. Their (Kevin’s and Paul’s) trade value was high, and so the Celtics received many assets in return, mainly several future first round draft picks. Unfortuantely for Brooklyn (the team to which Garnett and Pierce were traded), their newly acquired stars began to decline, and Brooklyn’s failure to perform only improved the value of the assets now in Boston’s hands. Two of the picks given to Boston by Brooklyn resulted in the drafting of Jaylen Brown and Jayson Tatum (both #3 picks), who would soon become the new stars of the outstanding franchise.
So, was Danny Ainge simply lucky in trading his stars when he did? Should Brooklyn have anticipated this outcome? As all data scientists do, let’s turn to the data. The following graphic shows NBA player performance by age. The metric representing “player performance” is WS/48, or win shares per 48 minutes. This is an estimate of the number of wins contributed by a player per 48 minutes and is often used to describe overall player impact. Specifically, the graph shows the distribution of ages at which players achieved their max WS/48.
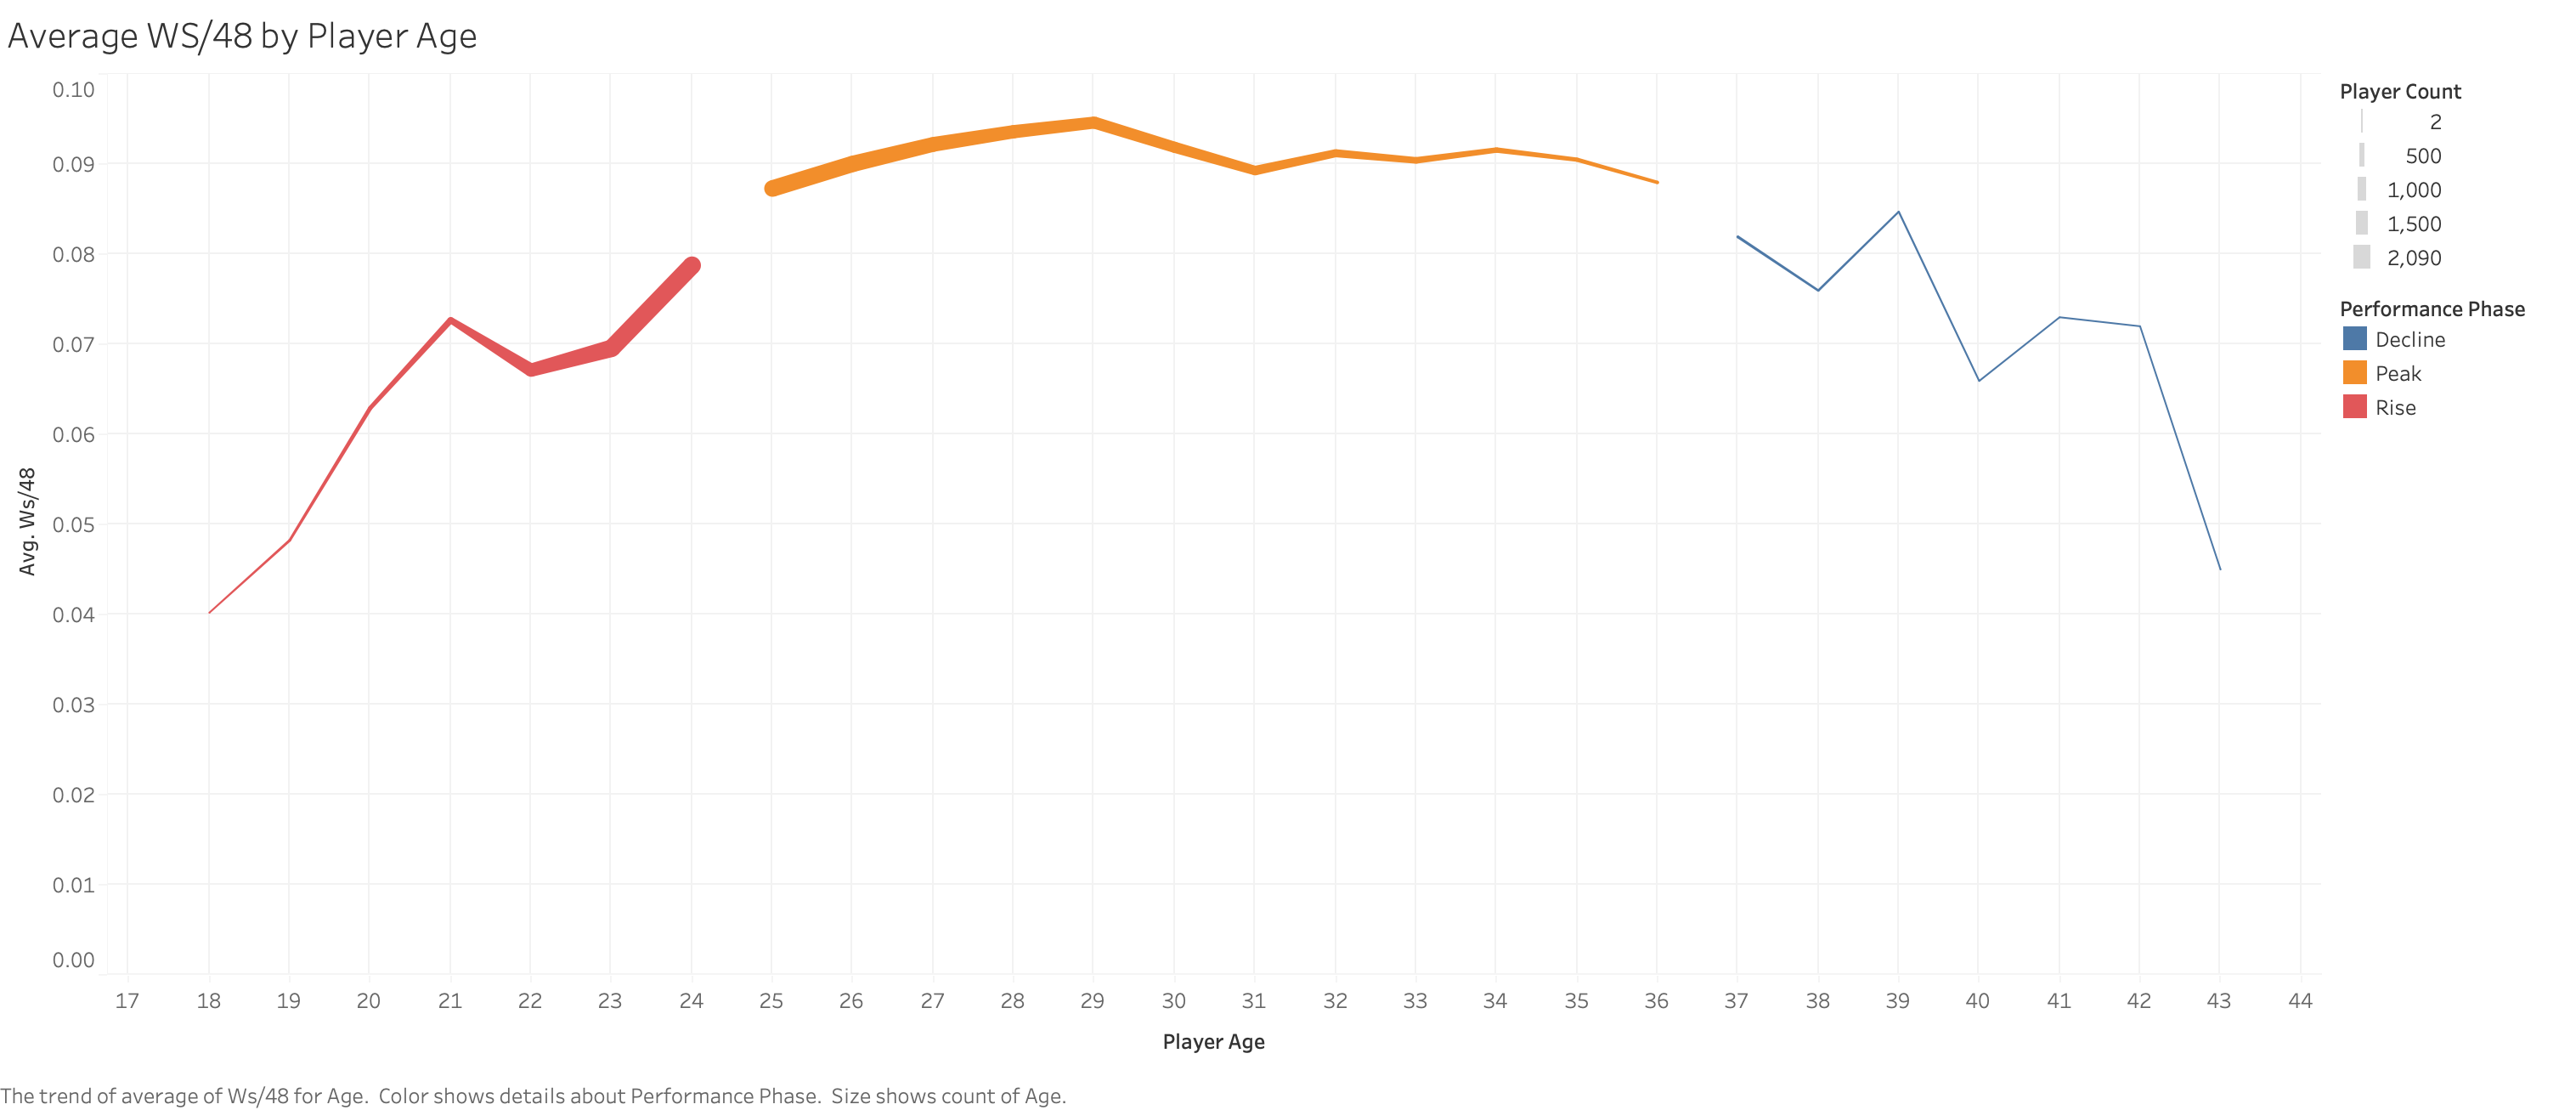
As you can, players typcially peak between ages 25 and 36. Interestingly enough, the players Ainge traded were ages 36 and 37, right at the end of their peak and the beginning of their decline… perhaps Danny Ainge hired a data scientist to help him!
Click here to access the repository containing the related data and scripts for the project.